Talero Talents Dashboard
One dashboard from game data to career insight
The candidate-facing product surface of Talero: it turns raw behavioural-game output into an explainable personal profile, behind per-user authenticated access and a Stripe-gated plan.
Visit talents.taleroai.com
About the project
Everyone who plays the Talero behavioural game generates a dense set of results: personality traits, cognitive and emotional signals, work archetype and career fit. Those results are written to the database during play; the dashboard is where they become useful. It reads each user's own records, visualises them against meaningful benchmarks, and turns a score dump into a profile someone can actually act on. It also owns the parts a product needs to survive contact with real users: secure authentication, paid plan gating, editable profile data and a feedback loop.
Stack
Noticeable changes
- Turns raw behavioural-game output stored in the database into a visual, explainable personal profile covering personality, cognitive and emotional signals.
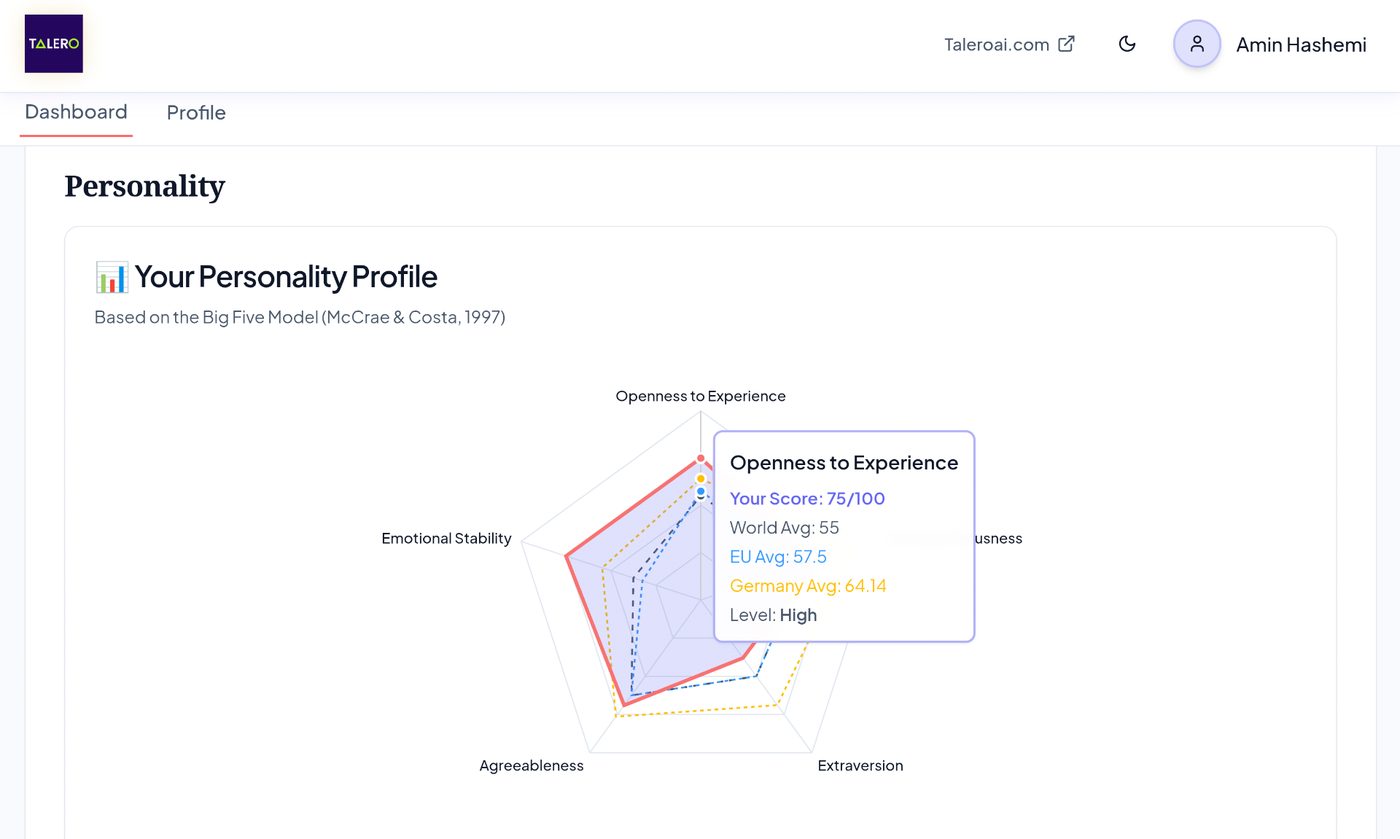
- Benchmarks every trait against world, EU and country averages so scores carry meaning instead of sitting as bare numbers.
- Gates premium report sections with Stripe subscription state resolved server-side, not in the browser.
- Scopes every data read to the authenticated user at the database level, so one session can never reach another person's results.
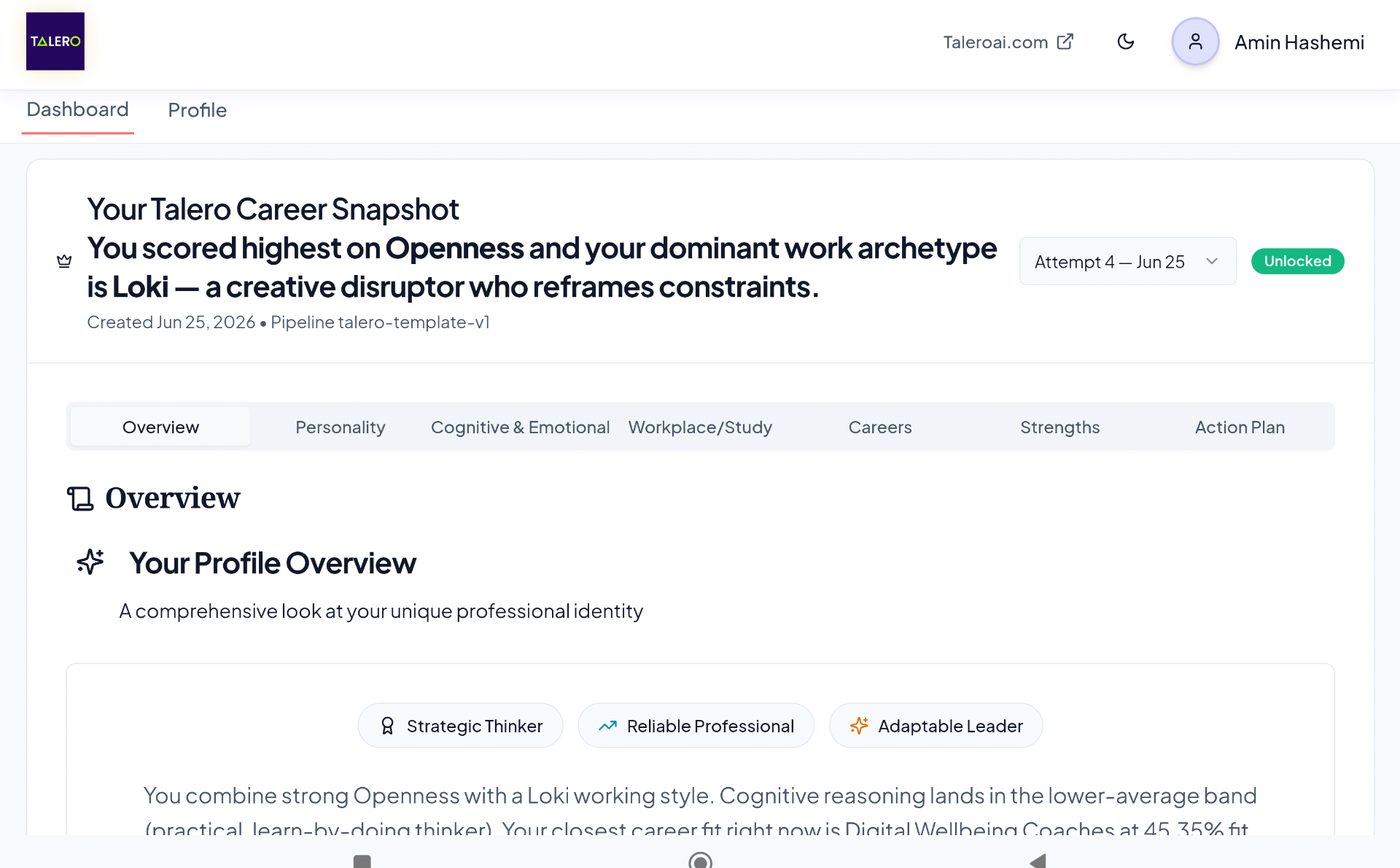
- Organises a dense psychometric report into seven researched, tabbed sections with attempt history preserved rather than overwritten.
From game data to insight
The game is only the collection layer. Every attempt is persisted with its pipeline version, and the dashboard reads back the signed-in user's own attempts and renders them as a single career snapshot: dominant archetype, headline finding, and a summary written in plain language rather than raw psychometric output. Past attempts stay selectable instead of being overwritten, so progress over time is visible.

Comparison, not just numbers
A score of 75 means nothing on its own. Each Big Five trait is plotted against world, EU and country averages, so a user sees where they actually sit rather than an abstract number, with strengths and weaker areas separated visually instead of averaged into one figure.

A profile the user owns
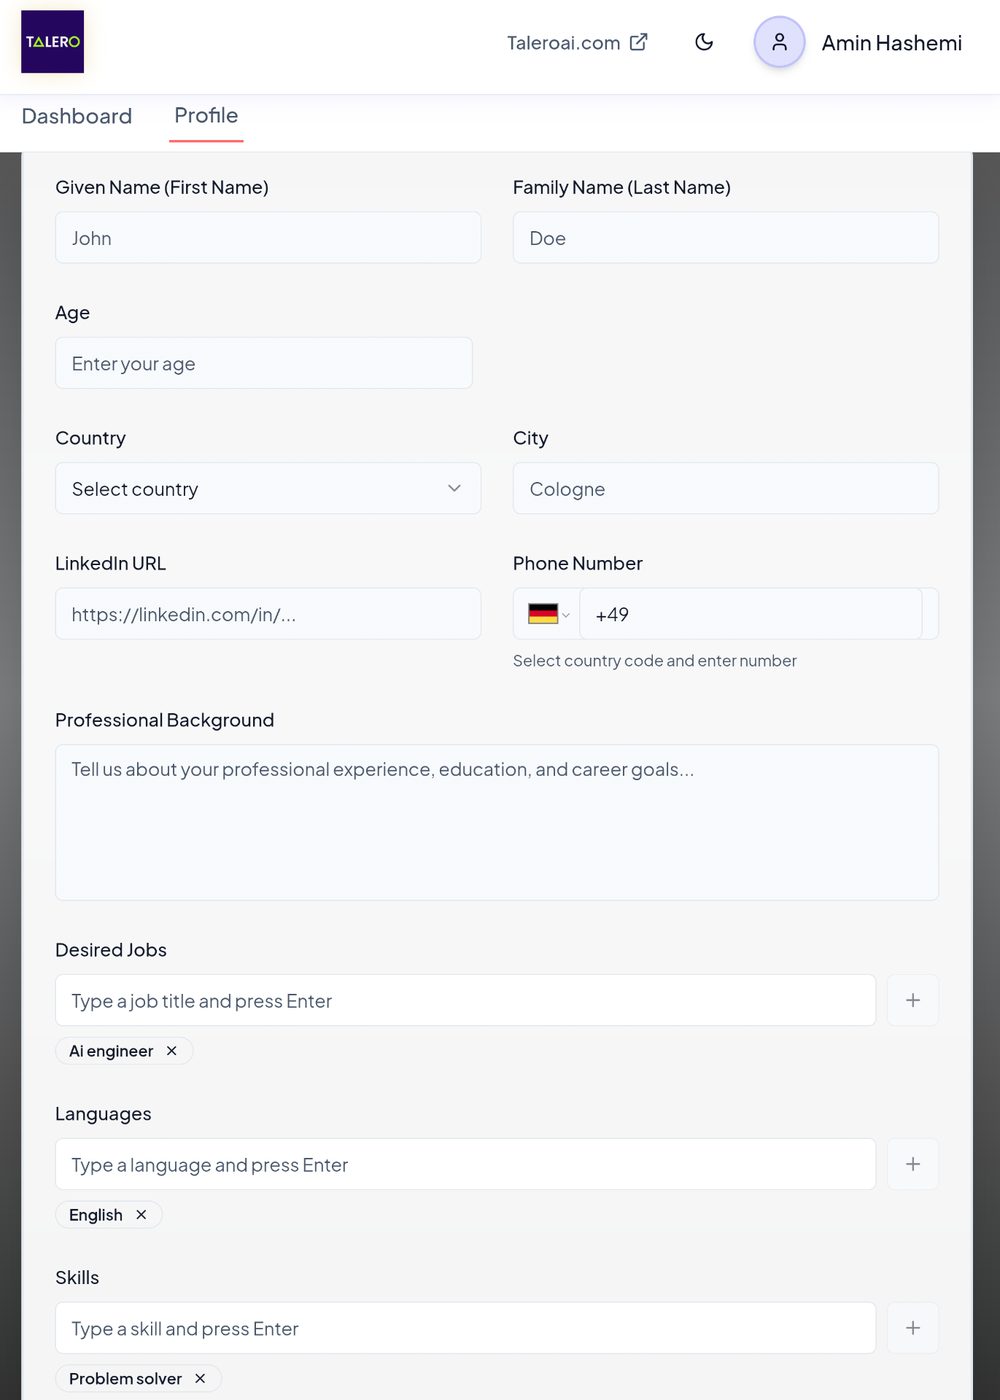
Game evidence is only half the picture. Users maintain their own professional background, desired roles, languages and skills, which feed straight back into role matching. The form is deliberately forgiving: tag-style inputs, country and dial-code selection, and no required-field walls that block someone from seeing their results.

Access, payment and privacy
- Secure per-user authentication: every read is scoped to the signed-in identity at the database level, so no session can reach another person's results.
- Stripe-backed plans: premium sections of the report are gated by subscription state resolved server-side, never by a flag the browser can flip.
- Minimal exposure: the dashboard requests only the fields a view needs, and sensitive profile data never leaves the authenticated boundary.
- In-product feedback: users can report what was useful or wrong, which feeds the next iteration of the report.
UX research behind the layout
A psychometric report is a lot of information at once, so the structure carries most of the work.
- Seven tabbed sections (Overview, Personality, Cognitive & Emotional, Workplace, Careers, Strengths, Action Plan) keep a dense report scannable instead of endless.
- The most decision-relevant answer, archetype and dominant trait, sits above the fold; the evidence sits behind it.
- Charts always carry a plain-language reading next to them, so the visualisation is never the only explanation.
- Light and dark themes, and a layout that holds up from phone through tablet to desktop.